Transforming the Claims Appeal Process with Data Visualization
BACKGROUND
In the complex world of financial services, having precise insights into process changes is critical. Our client, a large financial services firm, faced a significant challenge—they needed a comprehensive, automated, interactive dashboard to gain clear insights into their claim appeal process. Their vision for the dashboard would enable them to track trends year-over-year (YoY) and month-over-month (MoM).
Previously, a dedicated member of the client’s claims team manually updated a spreadsheet to monitor claim appeals. This spreadsheet, essentially a makeshift database, contained four years of appeals data. Without a proper reporting system, the leadership had no visibility into the trends of appeals, the impact of process changes, or the capability to make informed, data-driven decisions
SUCCESS STORY
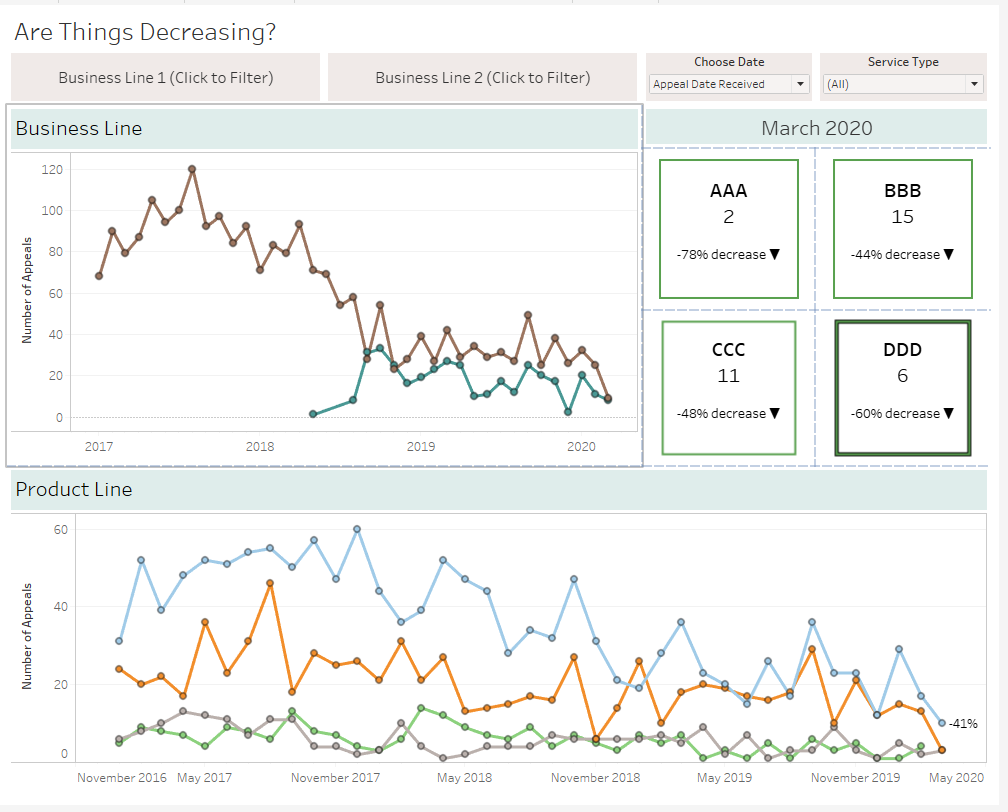
To tackle this, the CSpring team developed a dynamic dashboard that automatically updates daily as new appeals are logged by the claims department. This interactive tool allows stakeholders to filter and manipulate the data according to their specific needs. For example, they can switch between the date the appeal was received and the decision date for the appeal. At the request of claims leadership, the dashboard features two line charts illustrating trends for two distinct lines of business and their respective product lines. Additionally, it includes four critical appeal categories that highlight MoM changes, with color-coded indicators—red for increases and green for decreases—that update in real-time.

*Data has been altered for confidentiality.
BENEFIT TO CLIENT
Transitioning from a manually updated spreadsheet to an automated, interactive dashboard has been transformative for our client. They now possess comprehensive insights into their claim appeal processes and trends. This powerful tool equips them with the data-driven insights necessary to make informed decisions, ultimately enhancing their business operations.
Need help creating data visualizations for your business? Send us a message and schedule your free consultation today.