
by Casey | May 28, 2020 | Blog
Using Data Visualization to Understand the Claims Appeals Process BACKGROUND A large financial services firm needed insight into the changes made to their claim appeal process. They wanted a fully automated dashboard to better understand how their appeals were...
by Casey | Apr 24, 2020 | Blog
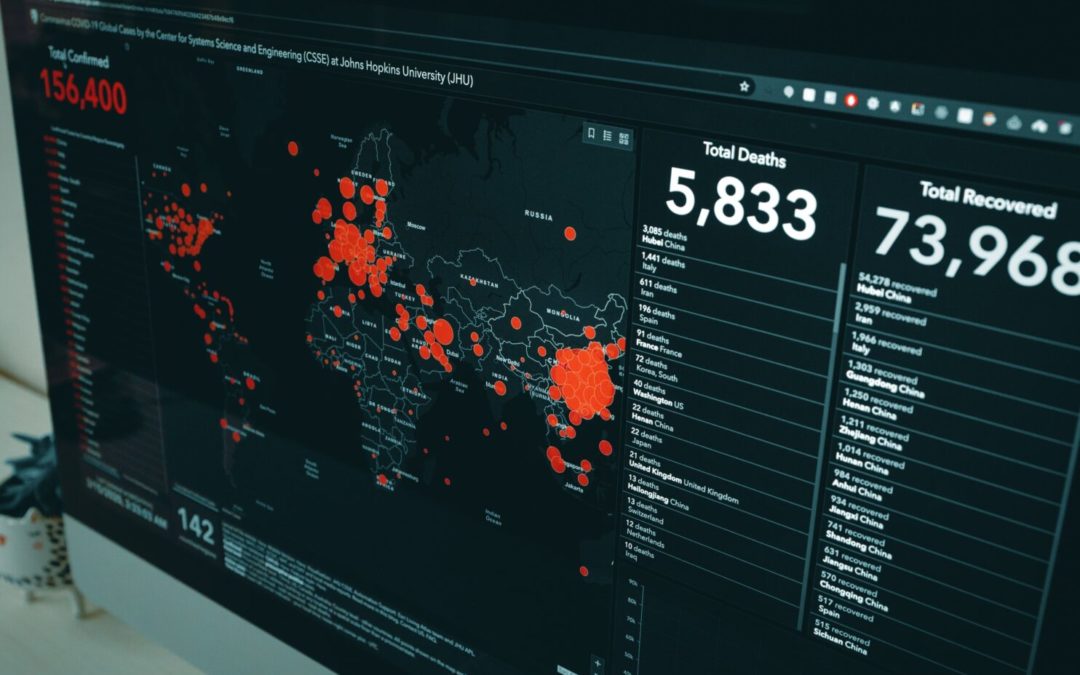
COVID-19 Data Visualizations If you’ve looked at a map, graph, or chart regarding COVID-19 over the past month, chances are it was a data visualization. They are being shared all over the media and online. The many different visualizations prove to be an example that...

by Emma | Mar 16, 2020 | Blog
The Importance Of Understanding Your Data Have you ever heard the saying “the journey is more important than the destination”? Data Analytics projects aren’t exempt to this – it’s easy to let final deliverables take precedent over the process. Whether your end goal is...

by Casey | Nov 14, 2019 | Case Study
Transforming Non-Emergency Medical Transportation Ride Quality Through Technology BACKGROUND Having healthcare insurance means nothing if you’re unable to use it – or have no way to get to your healthcare provider. The Code of Federal Regulations “requires States to...

by Casey | Nov 11, 2019 | Case Study
Using Data To Lower Indiana’s Infant Mortality Rate THE CHALLENGE According to the Centers for Disease Control and Prevention, Indiana has the seventh-highest infant mortality rate in the country. Indiana’s infant mortality rate is the highest rate in the Midwest. In...